Saturday, August 22, 2009

The RBA essay: Policy responses to the Global Financial Crisis

This is an essay submitted for an Australian Undergraduate Economics competition, The RBA essay. The question asked:

"Policy Responses to the Global Financial Crisis. Many countries around the world are responding to the global financial crisis and the associated economic downturn with stimulatory fiscal and monetary policies. Discuss the appropriateness of these policy responses, and the extent to which the exact nature of these responses might matter. Essays should provide an overview of the theoretical arguments and also briefly consider the evidence, including the approaches adopted by different countries in the past"

This essay was a great opportunity for me to use some of the knowledge I have gained over the past year or so. Unfortunately, my chances of winning the competition are very slim. Reasons are:
i) The suggested word count for the essay is 2000 words. My essay word count is 3700!
ii) My primary source of information have been the blogs I have been reading on a regular basis. I'm not sure whether this source is acceptable in a professional essay. It is just that alternative sources, like IMF reports, are extremely tedious to read, as well as serious academic papers on the crisis.
iii) The question is very general, and it does not refer to a particular country one should look at. In consequence I have focused primarily on the US policies to deal with the current crisis, and in looking at past examples I have looked at Japan. I'm not sure whether singling out a country for all your examples is optimal.
iv) Last, but not least, is that to my knowledge I made two typos which said the contrary of what I intended to say. I corrected it in this essay, but I hope it doesn't cost me so much.

I think for my efforts I deserve a certificate of commendation, but it is not up to me to decide. In any case I enjoyed writing this essay, and it is probably my best blog-post to date in terms of synthesising the two main topics of monetary and fiscal policy.

Introduction:

The 2008-2009 Global Financial Crisis has sparked a revival in the way we think about Economics. Coming from a sustained period of low interest rates and low inflation, the ‘Long boom’ has ended and our economic policies have had to adapt to the situation at hand. We are now witnessing the largest reduction in global GDP since WW2, with the IMF forecasting a –2% growth rate for 2009. In consequence to the global downturn, a number of countries are combating the crisis with stimulative monetary and fiscal policy. My aim is to explore the efficacy of these policies as applied in the US, with a focus on whether they encourage or impede recovery.

Central Bank rate reductions are not being passed onto households and firms: A 'Credit Crunch'

Since the advent of the sub-prime mortgage crisis in 2007, there have been large reductions in interest rates in a range of countries, where countries like the US and Japan have reached the ‘0 lower bound’ on nominal interest rates.

Figure 1: Global Expansionary Monetary policy
Koo,2009

The question is, has this been effective in reducing interest rates to businesses and households? The problem is, because of frictions in credit markets, financial institutions are simply not passing on rate reductions on to their customers. This is in large part due to the high credit and liquidity risk that exists in interbank markets, that is, the majority of a bank’s source of funding is lent at much higher rates than Central Banks’ rates. This is represented by the Libor-Ois spreads.

Figure 2: Credit spreads for Major Advanced Economies
Battellino,2009

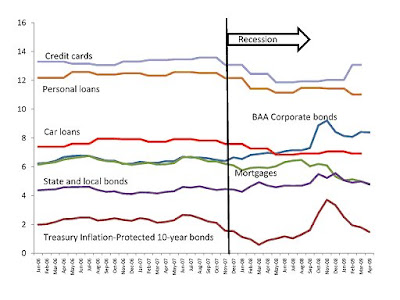
This is crucial to understanding why a whole range of rates have dropped very marginally, and in the case of corporate bond rates, have risen!

Figure 3 Credit Crunch affecting interest rates to households and firms in US
Woodward&Hall,2009

It is clear that on the Monetary Policy front, merely cutting the cash rate towards 0 has not been enough to stimulate the economy. Thus there has been a turn to ‘unconventional monetary policy’ in this crisis.


The Liquidity Trap: How conventional Monetary Policy loses traction

It is established that despite near 0 interest rates, there are still additional policies Central banks can use. One such response that has been used is Quantitative easing, which are attempts to increase the size of the Central Bank’s balance sheet by purchases of securities, and crediting the payments to reserve accounts at banks. These are regular open market-operations, with the difference being that interest rates are now constrained by the 0 lower bound.

In normal times the Central Bank purchases of securities puts upward pressure on the price of bonds, lowering interest rates and the cost of funding in credit markets. The injection of reserves into banks will be lent out at lower interest rates, and this new cash inflow to the economy will stimulate economic activity and make the final money supply increase much larger than the initial injection of High-Powered (HP) Money.

Figure 4 HP money growth deviates from broad Money Supply Growth in Japan
Koo,2009


Therefore the success of Quantitative easing is contingent on the extra reserves being lent out. Unfortunately there is no longer this mechanical connection between HP money growth and broader measures of the money supply. This is apparent in Japan's 'lost decade', which was the first experiment of Quantitative easing (Koo,2008).

As Japan’s recession began, a divergence between HP money growth and broad measures of the money supply/domestic credit growth became apparent. The problem is that the excess reserves are increasing due to Banks requiring excess reserves as a safety net to repay debt, to raise capital, and from pure credit rationing to consumers and firms. A large increase in deposits at the Central Bank (excess reserves) is the case for the US, Japan, EMU and England (Batellino, 2009).

Figure 5 Excess reserves increasing in major advanced economies
Battellino,2009


Given that money supply creation is dependent on lending excess reserves, this increase in the effective reserve ratio means the money multiplier, which measures the increase in money supply due to a $1 increase in HP money, is now less than 1 in the US.

Figure 6 Falling Monetary Multiplier in US
Mankiw, 2009

The problem of conducting quantitative easing is that when interest rates are so low, money and bonds become near-perfect substitutes. What happens is that the purchasing of securities by the Central Bank and the corresponding injection of reserves into banks has no real effects, as reserves are risk-free assets that are comparable with bonds. This is the theory of 'liquidity preference', put forward by Keynes to show how a 'liquidity trap' constrains lending, as banks are willing to sit on a pile of reserves at such low rates, as they are more liquid and earn the same yield as bonds.

Using the IS-LM model, the liquidity trap can be represented by an infinite interest elasticity of money demand at low interest rates, and a horizontal LM curve. The result is that any increase in the Money supply equilibrates Money demand without a lowering of interest rates (as interest rates are constrained by the 0 lower bound). Thus a rightward shift of the LM curve leads to no effect on equilibrium income.

Figure 7 The liquidity trap: Conventional Monetary Policy becomes ineffective
A creative solution: Charging Banks on holding excess reserves

A policy conundrum at present in the US is the Fed’s paying of 0.25% interest on excess reserves. The main reason for such a policy is to maintain a floor on the Fed Funds rate, as Banks will not lend to each other at rates below the rate at which their risk-free reserves earn. However, given that the economy is suffering from a lack of availability of credit, it makes more sense for the Central Bank to tax excess reserves (Woodward&Hall, 2009) This would increase the incentive to lend excess reserves, and we would obtain a stronger linkage between HP money growth and broader money supply growth.

Such a policy would be in line with a Taylor rule (A Monetary rule which calculates interest rates as a function of deviations of inflation and output from their natural rates), which the Federal Reserve calculates at roughly –5% for 2009 (Macroblog,2009)

Figure 8 Taylor Rule projections for Fed Funds rate in US
Macroblog,2009


Such a policy could give impetus to Quantitative Easing, which has been ineffective in stimulating the economy.

Further Innovations in Unconventional Monetary Policy in 0 lower bound conditions:


Figure 9 The Burgeoning Fed’s Balance Sheet
Woodward&Hall,2009

Monetary Policy in the US has involved diversifying and changing the composition of the Central Bank balance sheets. Looking at the above balance sheet, instead of purchasing treasury securities (conventional monetary policy), the majority of their purchases are private securities (classified as ‘other assets’). The intention is to create price stability in a range of asset markets, by driving their price up and moderating their yield, with the additional advantage of taking these assets off their balance sheets and supplying the much-needed liquidity. This has been termed ‘credit easing’ by Bernanke (Battellino,2009).

Whether ‘credit easing’ has effect is uncertain. One critique is that it may not change the price of assets enough to create a new equilibrium at which investors are confident in the value of private assets. This is because the markets for private assets are of a much greater magnitude than the $2 Trillion worth of private assets bought by the Fed, and the increase in demand is not enough to significantly increase the price of such assets. The Fed is also taking the role of a private bank- by investing in assets with much higher risk than its non-risk counterpart treasury bills (Krugman,2008).

Another unconventional monetary approach in 0 lower bound conditions is to invest in longer-term treasury bonds. The idea is that, if yields on short-term treasury securities have bottomed out, then it may be worth reducing yields on long-term bonds, trying to create low interest rates for a prolonged period of time. By flattening the yield curve, this can help in raising inflationary expectations and hence reducing the real rate, which will help ease credit conditions and induce consumption and investment (Krugman,2008).

Unconventional monetary policy is seen as essential to prevent ‘adverse feedback loops’ (Mishkin, 2009) in which, had these unconventional balance sheet operations not been conducted, there would be increased uncertainty in asset values, causing further contraction in credit, more uncertainty in asset values, leading to a vicious cycle of falling asset prices and confidence. There is no doubt that part of the reduction in credit spreads since the sharp increase in September 2008 is due to unconventional Monetary Policy. However the main problem is that Monetary Policy has lost traction in controlling economic activity and inflation, and this has required the increased involvement of fiscal policy.

Fiscal Policy Responses in the area of Financial Stability:

A major fiscal measure to stabilize financial markets is the advent of ‘Government guaranteed’ deposit insurance. The idea is that a Bank is much more likely to obtain funds if their debts are covered by the Government. Even in Australia, where Banks have managed to retain their AA ratings, the majority of bond issuance has required deposit insurance (Debelle,2009).

Figure 10 The effectiveness of deposit insurance for Australian banks’ borrowing
Debelle,2009


The main fiscal measure in this crisis has been capital injections. This is in light of the fact that in a systemic crisis, with little demand for funds, Banks can only be recapitalised via a capital injection (Koo, 2009). Capital injections have come in the form of nationalization of banks as in the UK, in which there is a large equity stake in the Bank, or more subtle forms such as the ‘TARP’ program in the US, which are aimed at removing ‘toxic assets’ of Balance sheets.

The problem with measures such as the TARP is that they may be funding institutions only to the point that they can cover all losses to debt holders, but only barely. Subsequently, ‘stress tests’ used to determine the amount of capital required is only to sustain solvency, rather than a full-recapitalisation (Woodward&Hall,2009). Much of the hope of US financial stability policies rests on the idea that assets are wrongly priced and that there is an expectation that once the ‘crisis of confidence’ wanes asset prices will increase and banks’ balance sheets will begin to look healthy again.

Avoiding bankruptcy is useful in a systemic crisis, as evidenced by how influential the failure of an institution ‘too big to fail’ such as Lehman Brothers was. In that case, it is useful to consider the idea of the ‘Good Bank, Bad Bank’ solution, where the ‘Good Bank’ takes all the assets with a steady cash flow, and can sustain itself with little capital injection. The ‘Bad Bank’ takes the rest of the assets that have deteriorated in value, and are subsidized to the extent that all liabilities are covered by Taxpayer’s money. The advantage is that now financial markets are aware of the status of each institution, and this may reduce credit risk (Blinder,2009).

The paradox of thrift: How a reduction in demand for funds requires fiscal policy to come to the fore


A deflationary spiral of reduced income, inflation and increased unemployment is a real threat at the moment. The problem is that the crisis has resulted in the deterioration of balance sheets of not only the financial sector, but households and firms as well. In the US for example, there has been a large increase in the household saving rate in response to a collapse in housing prices and the uncertainty of future income (Thoma, 2009).

Figure 11 Personal Saving rate for the US is on the rise
Thoma,2009

Another indication of a de-leveraging private sector is the demand for loanable funds in the US, by both small and large firms. This is another reason for the break in the linkage between HP money growth and the broad money supply, as a lack of borrowers tends to shrink the money supply.

Figure 12 US demand for funds is weak
Koo,2009


This weak demand for funds suggests that there will be insufficient consumption and private-sector (both residential and business) investment for quite some time. As the leakage generated from increased household savings and debt repayment exceeds the injection of new investment, the economy must adjust via reduced income. This holds particularly true in a world where interest rates are constrained by the 0 lower bound (Krugman, 2009).

Figure 13 Paradox of Thrift, Increased savings contracts the Economy
Krugman,2009


The return of Fiscal Stimulus: How it can mitigate the deflationary gap

When examining the use of Fiscal stimulus, one must first realize that its necessity derives from the inefficacy of monetary policy to deal with the deflationary gap. Given frictions in credit markets reducing the availability of funds, combined with a reduction in demand for funds, means there is an excess supply of desired savings (Krugman,2009).

Figure 14 Excess supply of desired savings at above equilibrium interest rate
Krugman,2009

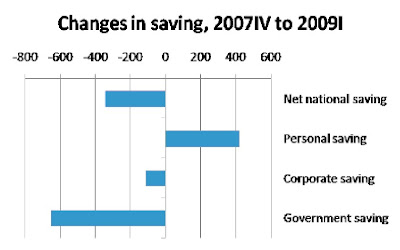
In the above diagram, the equilibrium interest rate i0 cannot be achieved due to the 0 lower nominal bound (Taylor rule gives i0=-5%). This excess desired savings, to not result in a deflationary spiral, must be offset by a reduction in Government savings. This has been occurring in the US, as well as other countries (Krugman,2009):

Figure 15 Government borrowing required to offset increased personal savings
Krugman,2009

The importance of accommodative Monetary Policy for effective fiscal stimulus

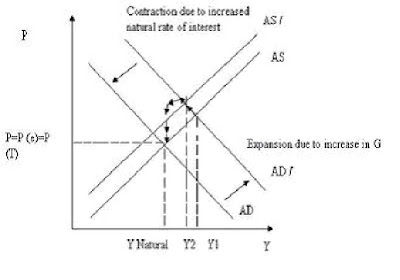
It is important to understand that the final effect of fiscal stimulus is dependent on its interaction with Monetary Policy. Looking at the Aggregate Demand/Supply (AD/AS) diagram, an increase in Government spending translates to a rightward shift of the AD curve. If at full employment, this will lead to increases in inflationary expectations, which shifts the AS curve up. As inflationary expectations are entrenched above an inflation target, the Central Bank responds by increasing the natural rate of interest, leading to a leftward shift of the AD curve and a return to the original equilibrium. The only change is that the increased government spending is offset by an equivalent reduction in private sector investment (which reduces due to the increased interest rates) (Blanchard,2007).

Figure 16 Fiscal Policy in a Fully-Employed Economy has no medium-run effects
Blanchard, 2007

This analysis is simply not applicable in the current conditions, as the economy is NOT at full employment. Unemployment has increased up to 5% points in the US since the recession began.

Figure 17 Unemployment in the US is steadily increasing
Mankiw,2009

Even with a Central Bank committed to maintaining low inflation, at current we suffer from deflation risk. By implication, inflation will only return to a desirable level once the economy has reached its natural growth rate and is on its way to recovery. Thus the Central Bank will be accommodative for a long period of time. Measures such as flattening the yield curve imply the commitment of Central Banks to maintain a long-term structure of low interest rates. Accommodative Monetary Policy forms the backbone of effective fiscal stimulus, as can be seen by the IS-LM model.

Figure 18 Fiscal Policy very effective in a Liquidity trap

The above model shows how in a liquidity trap, the increased income from a fiscal stimulus (rightward shift of the IS curve), leads to an increase in money demand, which is satiated at a 0 interest rate. This accounts for the horizontal LM curve. To incorporate the concept of full employment, suppose the fiscal expansion is excessive. If it carries the economy beyond income at full employment, by implication, inflation will start increasing. This will cause Monetary policy to shift the LM curve up, (LM0 to LM1), to return economy to full employment. A lesson from this simplistic model is that it is better for the Government to have a large fiscal stimulus, rather than too little.

Dispelling the treasury view: Deficits do NOT raise interest rates under 'depression-like' conditions!

A corollary of accommodative Monetary Policy is that Budget deficits do not exert upward pressure on interest rates in current conditions. Both the Japanese ‘lost decade’ and current US recession show strong negative correlation between budget deficits and interest rates (Krugman,2009).

Figure 19 Japanese Budget Deficits coincide with reduced long-term bond rates
Koo,2009

Figure 20 US Budget Deficits coincide with reduced long-term bond rates
Krugman,2009

Fiscal policy is required to maintain money supply growth:

It has been noted that part of the reason for the inefficacy of Monetary Policy is the reduction in the demand for funds by de-leveraging households and firms in the US. If this reduction in demand for funds is not countered by increased government borrowing, the money supply will continue to shrink. Government borrowing from the Central Bank would increase the money supply as the Central Bank purchases treasury securities by injecting Reserves in Banks. On the other hand, if fiscal stimulus is financed by the Private sector, then Money supply will still increase, as by creating the incomes of workers in Government funded projects, the proceeds of Government spending will filter through to the Banking system and prop up the Money supply. This is evident in Japan (Koo,2008).

Figure 21 Japan’s Government Borrowing supported Money Supply growth
Koo,2009

By helping increase the money supply, it is helping to prop up the availability of funds to the private sector, and has indirect effects in terms of increasing the flow of funds and hence the velocity of money. Thus in a liquidity trap, Government spending can actually boost the money supply and hence Private Sector Investment. Japan’s ‘lost decade’ is an example of Fiscal policy maintaining money supply growth.

Japan's stop-go policy: how premature fiscal consolidation can lead to disaster

In 1997, Japan’s Prime Minister Hashimoto decided on a plan of fiscal consolidation, to reduce the 22 trillion yen deficit of 1996 by 15 trillion. The plan involved raising the consumption tax from 3% to 5%, increasing social security costs and shelving a supplementary budget (Koo, 2008). Instead of reducing the deficit, the economy shrunk for 5 consecutive quarters, and the deficit increased to 38 trillion in 1999. A deflationary spiral was induced, as Government deficits no longer countered the private sector’s de-leveraging.

This raises an important lesson, as it means the timing of fiscal consolidation is very crucial to the economic recovery. Given that Japan suffered from a corporate sector with insufficient demand for funds, fiscal consolidation should be practiced only when private sector investment is emerging.

Figure 22 Fiscal consolidation in 1997 led to a recession, reducing tax revenue and increasing future deficits Another lesson is the notion of fiscal sustainability. A fair critique to fiscal stimulus is the debt burden imposed on future generations. The need to have a stream of budget surpluses in the future to pay off the debt is crucial. However, from the above example, receding Government spending now is not going to reduce the future debt burden, but actually increase it. With no fiscal stimulus, the deflationary spiral that ensues will cause income and hence tax revenue to contract, causing both budget deficits and an increase in the future debt burden.

The structure of fiscal stimulus: Government spending or Tax Cuts?

The first comparison one can make between Government spending and Tax Cuts are their respective multipliers. The Obama Administration, for example, believes their fiscal stimulus multipliers are 1.55 for Government purchases and 0.98-0.99 for tax cuts after 16 quarters. Government spending multipliers are always greater. The reason is simple; as Government spending has immediate 1st round effects of creating income, however tax cuts are contingent on the extent to which households consume.

Keynesian theory says the Government spending Multiplier


> Tax Cut Multiplier , where MPC is marginal propensity to consume, and t is the marginal tax rate. If we assume values of MPC=0.5, t=1/3, the ‘bang for buck’ (the increase in income per $ of future debt) is 3 for Government spending and only 1 for a tax cut, which shows that Government spending is better from a fiscal sustainability point of view (Krugman, 2008).

Another comparison of Government spending and tax cuts refers to the notion of Ricardian Equivalence, which is the extent to which private sector savings increases in expectation of the future taxes required to finance the Government debt.

With tax cuts, it is crucial that they be permanent. If temporary, in the form of a tax rebate, then households are likely to save it in expectation of future increases in taxes, and partially because it does not reflect a permanent increase in their income. This was evident in the tax rebates in the US 2008 Stimulus package (Taylor, 2008).

Figure 23 Tax Rebate is fully saved in US, with no stimulatory effects on consumption
Taylor,2009

On the other hand, despite the increase in household savings, cash transfers to low-income households may be effective, in the sense that they are a group whose consumption will be depressed more and may have a higher MPC. Permanent tax cuts will avoid Ricardian Equivalence, however, it is impractical in the sense that taxes need to be raised in the future as part of fiscal consolidation.

Let us look at Government spending. If a program requires $100B of government spending each year, consumers may save an amount equal, in present value, to the accumulated deficits, leading to an offsetting reduction in consumption. It is temporary government spending that avoids Ricardian equivalence, as

“…rational households would realise that the increase in their lifetime tax bills would be quite modest, which would imply a small reduction in consumption demand relative to the large increase in government purchases.”(Econospeak, 2009)

Some cite the incentive effects of tax cuts as a reason why tax cuts can lead to growth. There is little doubt that investment tax cuts, such as a cut in capital gains tax, company tax, tax rebates for innovation, a cut in payroll tax, do provide some impetus for investment and labour demand, effects not included in previous comparisons. A creative use of tax cuts, consistent with budget neutrality, are to enforce a permanent payroll tax (lowering cost of employing workers) with a gradual increase in fuel tax (Mankiw, 2009). The problem with supply-side tax cuts is that they may in fact have negative multiplier effects at the 0 lower bound! This is because of the deflationary pressure, which cannot be counteracted by nominal interest rates constrained by the 0 lower bound (Eggertsson, 2008).

This uncertainty of ‘incentive’ effects of tax cuts, coupled with Government Spending’s higher multipliers, accounts for why many countries around the World are having stimulus packages comprising a majority of Government spending. The limitation of Government spending is that there are only so many ‘shovel-ready’ projects, it is harder to implement and operates with a time lag, whereas tax cuts have immediate effect. Though Governments are likely to stimulate industries with excess unemployment (construction in the US), they should actively try to make their spending measures socially justifiable, to create a framework for private investment, and investing in key areas such as renewable energy, health and education.

Conclusion

After examining Monetary Policy, I conclude that we are in a liquidity trap situation, where conventional monetary policy loses traction, and frictions in credit markets disable the regular means of increasing the money supply. Given an insufficient demand for funds, and an excess supply of desired savings, it gives fiscal policy a mandate to dissave to restore equilibrium and prevent a deflationary spiral. It is necessary that Fiscal stimulus be temporary, and should only recede once the recovery is self-sustained by the Private Sector. The financial system must be restored to good health, and credit flows must return to normal levels. The policy-makers of the US and other countries are on the right track in trying to sustain demand, and will be able to avoid a 2nd Great Depression.

Saturday, August 15, 2009

What can we learn from Japan's lost decade? A primer on Koo's "Balance Sheet Recession" theory

Japan's 'lost decade' is a powerful precedent for our current crisis. There are some fundamental linkages between the aftermath of Japan's real-estate bubble in 1987 and the aftermath of the US housing bust. Some similarities, such as prolonged deflation, the liquidity trap, and unconvential monetary policies (ie Quantitative easing) were dealt with in previous topics. My aim is to expand on how both monetary and fiscal policy functioned in Japan, in light of Richard Koo's "Balance Sheet recessions" theory. I will then try to relate the Japanese crisis to our current situation, and whether it entails any policy lessons for us to follow.

The Japanese lost decade began as the real estate Hesei bubble collapsed. This triggered large reductions in commercial real estate prices, but over time it had spread to asset prices in general, and a 1500 trillion yen in wealth has been dissolved as a result.

There is a lot of debate on the nature of policy responses, and whether they could have alleviated the asset price deflation that has been the cornerstone of Japan's problems. Some analysts believe the problem is the Government refusing to liquidate 'Zombie' Banks, banks which hold a lot of Non-performing loans/Toxic assets. These banks created friction in credit markets, and reduced the supply of funding to firms and households.

The real misunderstanding of Japan's problem, in light of this theory, is to assume that the problem of insufficient investment was a by-product of an insolvent or under-capitalised banking system. Richard Koo makes a compelling case that Japan's problem was in fact a borrowers' problem.

Let us begin by looking at the failure of monetary policy:
Note that in normal times, Money Supply growth, High-Powered money growth and growth of domestic credit are roughly aligned. And yet, on the onset of the bubble crash, the 3 rates of growth diverged! What happened was the liquidity trap, a concept explained in my post 'Deflation and the liquidity trap'. The problem is that the linkage between the Central Bank's money-base and the money supply no longer holds. The Quantitative easing policies are put down by Koo as being the greatest ‘non-event’ of monetary policy. The injection of reserves to levels far in excess of the effective money supply is redundant.

Now, one might conclude that the fact that Japanese interest rates were very low, meant Banks had no incentive to lend excess reserves (theory of liquidity preference). However, one must realise that for the money supply to be increased, it requires not only the availability of lenders, but borrowers. This is often over-looked in determining the money supply, as the money creation process is dependent on loan creation. Though there were credit crunches during Japan's lost decade, notably the 'Takaneka shock' in 01-02, Koo makes the case that the decline in borrowing is the reason for stagnating money supply growth.


The above graph gives Koo's reasons for the corporate sector's unwillingness to borrow. He dissects the 'Zombie bank' argument by saying, that if there were a credit crunch, corporate firms would raise funding by issuing corporate bonds, there would be an influx of foreign banks to lend at more competitive rates, and lending rates by the commercial banks would be much higher than the BOJ cash rate. However, as the above graph shows, the opposite happened! This means that corporate firms did not seek alternatives via bond issuance, and lending rates to firms and households dropped over time! Thus a shortage of demand for funds suggests that excess reserves are not going to increasing lending.

More support comes from surveys conducted on banks' willingness to lend. Apart from the two credit crunches, the surveys indicate that where demand for funds existed, it was easy to obtain.

To explain the Japanese lost decade, Koo formulates a systematic approach called 'Balance-Sheet Recession' theory. His theory gives a negative feedback cycle which runs as follows:

i) The Corporate sector has suffered large falls in assets (from the unwinding of the Hesei real estate bubble)

ii) This leads to a situation where assets are less than liabilities, and firms are under in a negative equity position/undercapitalised

iii) Corporate sector begin to deleverage with the intention of shoring up balance sheets, by paying down debt rather than reinvesting cash flow/profits

iv) This reduces demand for funds even at low interest rates, as firms' are more interested in obtaining a net positive equity position. Evidence of this can be found in graph below, which shows both bond issuance and corporate borrowing from banks falling, and even becoming -ve towards the latter stages of the lost decade.


v) There is a consequent leakage from the circular flow equal to household savings+ net corporate debt repayment

vi) this leakge, if unmitigated, will lead to a deflationary gap, in which the reduced money supply growth (due to lack of borrowers), leads to falling income, prices and monetary velocity

vii) The deflation will cause further balance sheet problems, causing more deleveraging, further falls in asset prices, and feeds back to i), unless...

viii) The deflationary spiral above can be circumvented by a combination of increased net exports and government expenditure

ix) The fiscal expenditures required to fill up the deflationary gap is required until the corporate sector regains the ability to leverage and undergo net financial deficits. This can only happen once the corporate sector has paid debt and accumulated assets enough such that firms feel ready to become net borrowers.

How does the fiscal stimulus circumvent the deflationary spiral due to corporate deleveraging? The best way to look at it is that there is a paradox of thrift applying to the corporate sector, in which all firms are simultaneously paying down debt. This excess private sector savings will depress the economy unless mitigated by a reduction in public sector savings- that is, by government deficits. The reason for why such a plausible theory has only come to the surface recently is because of the simplifying assumption of many macroeconomic models, which implicitly assume that firms are always profit maximising. Though this is correct in normal times, in a 'balance-sheet recession', firms enter a mode of 'debt-minimisation' rather than 'profit-maximisation'.

Now that I have explained the underpinnings of Koo's theory, I will begin to trace some finer points, and to see if there are any lessons for our current crisis.

Fiscal policy is required to maintain money supply growth:

Another way of looking at the usefulness of government expenditure is to see it as increasing the money supply- this occurs as the expenditures by government are either financed by selling debt to financial sector- or by selling treasury debt to central bank, which finances purchases by increasing reserves in banks. Both ways there is an increase in the purchases of assets/reserves by banks, which increases the money supply. Given money supply growth is a determinant of inflation, maintaining money supply growth is imperative to prevent a deflationary spiral. Note that if the Government were not such a heavy borrower, the money supply would shrink, and note the indirect linkage- of how reduced money supply constrains the banks to lend to other prospective borrowers. Thus by maintaining money supply growth, it enables loan creation to be made to the private-sector, contrary to the claim that government borrowing always crowds out private-sector borrowing.

The key is accomodative monetary policy, as in a boom economy, government spending is likely to be over-inflationary, and monetary policy will curb excessive money growth by raising interest rates and offsetting fiscal stimulus by reduced private sector investment. However, given that there is an excess supply of loanable funds in Japan's case, the government is not at all putting pressure on the interest rate, as we shall see in the next point.

Dispelling the treasury view: Deficits do NOT raise interest rates under 'depression-like' conditions!

Contrary to the treasury view, there is negative correlation being exhibited between government deficits and interest rates. This is also occuring for the US at present. The reason is simple, interest rates will remain low until private-sector demand for funds picks up. Interest rates are also low because of the fact that government borrowing is propping up the money supply. If there is ever a crowding out effect, by implication there must be inflationary threats and the prospect of interest rate increases. However, we know that Japan suffered a prolonged deflation of around 0 to -1 percent, and so crowding out is never a reality.

Japan's stop-go policy: how premature fiscal consolidation can lead to disaster
In 1997 the Japanese Government put a 30 Trillion yen cap on new government bond issuance. This move towards fiscal retrenchment was induced by strong growth in 1996, and strong growth in tax revenue. This was a fundamental mistake, as at this stage the corporate sector was still in debt-minimisation mode. The intention of achieving fiscal sustainability was good, but it was too early.
From the above graph, you can clearly see that in 97 the deleveraging by corporate sector was far from over. Indeed, it only bottoms in 2005. Another graph shown previously looks at corporate borrowing, which was still negative in 97.
The fact of the matter is that the leakage generated by household savings and corporate net debt repayment exceeds the cap on new government bond issuance! This means the fiscal retrenchment led to a deflationary gap and a negative multiplier effect of falling income, falling tax revenue and an increasing deficit!
Combined with a credit crunch in 97, it forced the government to issue a new fiscal stimulus in 98, of 16 trillion yen. The below graph shows that the infamous 'stop-go' policy of the Japanese resulted in reduced tax revenue and increased deficits. This shows clearly that the timing of fiscal consolidation is important, and it should coincide with a healthy return of private-sector investment.

How Japan recovered- through net exports rather than a surge in private sector investment
The above graph from Krugman shows the division of growth for Japanese GDP from 2003 to 2007. Given that consumption growth was at trend, one can argue that net exports is the main determinant of Japan's recovery. This is worrying for the current crisis, because of its synchronised nature. The IMF believe that an export-led recovery is effective for a localised recession, however given the globally synchronised nature of the current crisis, it is hard to have an export-led recovery. This means that more of the leakage generated by lack of demand for funds must be mitigated by government spending, and makes more of a case for fiscal stimulus.
How to prevent future bubbles?
I have often felt that the main problem with inflation-targeting is that it often over-looks asset price bubbles. This is well known in the literature on monetary policy, however it is unfortunate that the main exponent of monetary policy, Alan Greenspan, advocated a 'clean up the mess' approach. This approach has worked in the past, to deal with the dot-com bubble, for example, however in this case the contamination of the housing bubble is testament to the danger of under-estimating asset-price inflation. The underlying problem is that many of these asset-price bubbles can occur during a period of stable inflation, money growth and monetary velocity. For example, one can see monetary velocity as quite stable prior to the crash of 1929 and Hesei crash. Why can stable consumer prices and rampant asset prices co-exist?


Koo says the main difference is that the asset prices often reflect an increase in 'deposit turnover' or churning. This occurs from a large velocity (rate of trading) of an asset, which tends to bid upward the prices of these assets (in the case of the current crisis, there would have been much churning from the securitisation of MBS securities, which raised their price and encouraged more lending in the mortgage market). Despite wealth effects generated from asset prices transferring to the rest of the economy, the fact that the 'churning' is localised means there is little pass-through to general prices in the economy.


The real problem is whether a central bank, in seeing the increase in deposit turnover- and various other measures supporting the notion of an existent bubble-can increase interest rates despite stable inflation. This trade-off between short-term and long-term deviations in inflation is tough, simply because you do not know if an asset price bubble will collapse or not. What makes it scarier is that interest rate increases to curb a bubble may actually 'prick' it, by causing asset prices to peak it may begin to fall rapidly. These problems must be addressed in the future, but I think financial regulators are in the best position to curb asset price bubbles, as they can enforce capital ratios and have more flexibility to deal with such situations. Central banking is a blunt instrument, too general in terms of its focus, and may not be enough to hinder destabilising speculation.

Monday, August 3, 2009

The financial crisis- A perspective on bailouts…is Government Intervention required?

This essay was written in September of 2008, in reply to the horrid week of the Lehman Brothers' Collapse, and the rise of the 'Paulson Plan'. Though some of this is outdated (In particular the 'Paulson Plan', which was swiftly changed from buying toxic assets to having an equity stake in firms), it is still a nice read, in that it looks in general at how the financial crisis developed and the nature and philosophy of bank bailouts. Unfortunately finance is not my cup of tea, but hopefully you will still enjoy this piece. This essay was the beginning of my burgeoning interest in the crisis, and it is nice to reflect on how much progress I've made since then.

What appeals to me in this financial crisis is the need for a coherent path of leadership in reforming the financial system. The financial system seems to have lead itself to its own catastrophic destruction, and we now face an almost structural problem of illiquid assets held by over-leveraged institutions right across the world, perpetuated of-course by the ungainly events of August 2007, when mortgage originators began to tumble in the US. The problem originates from the general trend of lending standards being lowered to unsustainable levels. By unsustainable it means that the rapid growth in lending, and in credit, has far overtaken the growth in lending for productive activates and the accumulation of productive capital. Such low doc housing loans could potentially be very profitable in backing highly sophisticated instruments like structured investment conduits and collaterised debt obligations (CDOs and SIVs). These instruments are backed by mortgages, and once this cash flow of funding liquidity is disrupted, then the assets of many institutions are in question. Once the cash flow of these assets dissipates, it is only natural that financial intermediaries engaging in this irresponsible lending should deteriorate.

These balance sheets are interconnected with many other institutions, including commercial banks, investment banks, insurance companies and the like. This is because one company’s debt obligations no longer have the cash flow to provide funding for the debt. What happens to these intermediaries is an inability to meet debt payments with a large cut of the sourcing of their funds. Naturally they turn to selling their assets, both their illiquid and liquid assets. If information is transmitted of the intermediary’s collapse, potential partners, by the nature of adverse selection, will insure themselves from the risk of buying up bad debt, and will not buy the assets of the intermediary, even if they are good. This is because they cannot take the risk of differentiating between the good assets and the bad assets, and can naturally conclude that any company in trouble will attempt to sell their bad assets at an inflated price.

What happens is an almost circular path of a company with an initially negative balance sheet becoming even more negative over time, with a declaration of insolvency the likely result. Note that the interconnection of financial institutions underplays another, more subtle role, that of financial innovations that have enabled companies to be in partnership, say a Hedge fund, or even directly lending to such intermediaries. The defaulting on debt by the intermediary can lead to a reduction in the source of funding for interconnected financial institutions. In some cases the interconnection is so poignant that the collapse of the intermediary brings about a phenomenal reduction in their source of funding.

What is sparked by the collapse of one such intermediary? What could potentially happen is a human element coming into play; a crisis of confidence could develop. The crisis of confidence will entail a large reduction in the lending capacity, as all financial institutions wish to hoard funds and assets rather than the healthy steady financial flow we witness in good financial times. A lack of trust due to asymmetric information is a market failure, as there are many credit-worthy assets that could be traded, but due to the inability to differentiate between a firm’s good and bad assets, no trades are made to begin with! The crisis of confidence highlights the systemic risk in a system that has reduced interest rates and leveraged institutions to fundamentally unsound levels.

The inclusion of Government in times of recession and depression is philosophically questionable. One can argue against government intervention solely on the principle of private enterprise, that regardless of the situation, the private sector management of a situation will lead to the optimal outcome. Yet with such a deep and prolonged financial crisis, the strains on the private sector are too deep-rooted to be solved by the private sector alone. The private market failure is occurring because in bad times the usual healthy flow of capital does not occur between firms. It is a tragic case of self-fulfilling expectations of a crisis perpetuating this contracting of economic activity, a circularity that cannot be cured by the private sector without a very painful recession-or depression, for that matter. The government has the ability to justify corrective action where the private actions do not cumulate in social returns. In this case the private actions are catastrophic for society, and the Government, as a provider of social infrastructure, must prevent such diversion of activities from taking place.

The government intervention has recently been taken in the form of take-overs, with the Fannie and Freddie may takeovers being seen as successful in significantly lowering mortgage rates and returning consumer confidence. The take-overs have been successful, but they are implemented only in exceptional cases. The catastrophic failure of these institutions poses a downside risk far greater than the losses incurred by government in meeting the funding shortfall of these institutions. The problem of Government intervention becomes more complex wherein there exists institutions that are not insolvent, that have great potential to re-capitalise, but at the moment are unable to do so. This re-capitalisation is integral to returning to normal levels of asset trading, and for firms to bolster their balance sheets and boost their credit ratings once again.

To kick-start these institutions is a problem being addressed by the US treasury, with the secretary of Treasury Henry Paulson declaring his ‘Paulson Plan’. This plan has a ‘calming effect’ in at-least reassuring Wall street that liquidity will be provided in the short to medium term. But conceptually it may not attack the real problem at hand. The problem is threefold, we have had problems with an unacceptably low levels of interest rates and leverage, we have had problems with excessive de-regulation of the financial system which has enabled systemic risk to rise to unsustainable levels, and the human element; the ‘crisis of confidence’ discussed earlier. The proposed solution, which in its general form is a $700 Billion bailout plan consisting of reverse-auctioning (to buy assets at the lowest bid price) the mortgage securities market. This intervention is in stark contrast to the intervention of the Great depression, where Government tended to intervene in buying the good stock of firms, but in this case the Government wants to buy the toxic waste bonds of the credit markets.

This solution is being seen by many as being a very short-term solution, a ‘throwing money at the problem’ rather than digging into the underlying problems at hand. One problem with the bail-out is the price at which securities will be auctioned. Will it be so low that the selling of securities at such a low price will in fact be even more disadvantageous to the competing firms? Will the price be too high such that there is an inequitable resource transfer from the innocent taxpayers to the guilty managers of ruptured portfolios and their shareholders?

The Government is intervening, as outlined before, to uphold its provider of social welfare for the people. But nowhere is it given an encouraged role to ‘reward’ the mistakes of exposed corporate managers and the respective shareholders of these firms. One such problem that may increase the price beyond the fundamental value is the case of moral hazard. Firms that rely on Government intervention to subsidise their losses tend to make more risky investments than they otherwise should in a situation wherein they receive no such assurance. This means that firms could well make a profit by selling at an inflated value to the Government and come out even stronger in relative terms after the bailout. If the Government were to require a warranty, to seek a return of profits contingent on the success of the firm after bailout, would this warranty minimise the moral hazard problem? According to the Modigliani and Miller theorem, this is not likely. All the warranty will do is to be capitalised into a higher price for these assets, where firms typically estimate the likelihood of success, and base their prices on the net present value of assets (where it must be discounted for the future earnings of Government shares of the company). This lower net present value means to retain a certain benchmark NPV, they require a higher price. Thus we are still stuck with a situation of how the price convergence is going to occur. At present market critics feel that the price is likely to be below their fundamental value, and there is more of a concern that the price may be too low to enable illiquid institutions from becoming operational again.

What is even more questionable is the relative impacts it will have on illiquid institutions relative to liquid institutions. This plan may have little impact on the solvent institutions, but may be largely wasted on institutions that may have little chance of recovery even after ridding themselves of the toxic waste. In such circumstances it would be ‘money better spent’ to spend on the fittest survivors of the market. Also is the natural question of whether there would be a return to pre-crisis standards of exchanging assets; whether re-capitalisation can actually occur in this method. One can only say that such levels will be returned to after a severe revamping of the financial system. The credit growth must be at a rate coinciding with rate of growth of productive capital. If the rate of growth of speculative capital exceeds the growth of productive capital, such an inequality of growth precipitates asset price bubbles. In this case the capital ratio must be rationed by banks to converge to steady levels of capital growth.

Financial crises are a backdrop from which economists, like myself, can analyse with vigour the workings and functioning of a largely unknown world. It is a painful experience, but a great one for learning, and having been endowed with an economist’s curiosity, I can’t help but indulge myself in such depressed times!

Saturday, August 1, 2009

Using WW2 to predict multiplier effects: Dissecting the Barro Argument

In the essay below I begin to draw on history to help understand the current fiscal stimulus. I will look at Robert Barrow's claim that WW2 multipliers have implications for modern day multipliers- and will attempt to prove that there is no linkage and that one must be wary of using history in the wrong context. In later posts I will look at more relevant examples of history, in particular the Japanese 'Lost decade'.

Keynes first coined the Multiplier concept in his theories on employment, interest and money. Given that it is a fiscal stimulus issue, over the last few decades, with Monetary policy leading the battlefront, no consensus estimate of the multiplier has been reached. This is largely due to the ‘no one size fits all’ complex, but is also due to a huge range of multiplier estimates from 0 to 3, with current Romer-Bernstein estimates of 1.5 (For increase in G) being a middle-ground.

The main problem is in fact that in economics, it is much harder to pursue ‘laboratory’ based evidence as in the harder sciences. Thus it accounts for why Romer-Romer estimates of a tax multiplier of 3 does not apply in reality- a lot of the estimates of the multiplier are exogenous/ceteris paribus estimates, which end up simplifying the economy, and do not take into account changing expectations on the part of consumers and other endogenous variables that may be affecting the Government spending increase/tax cut’s affect on the economy. Given that GDP is a function of so many variables, and given that expectations play such a significant role in determining those variables, it is extremely hard to pin-point the effect of a tax cut or spending increase simply because it is hard to predict how expectations will adjust…an example I have dwelled on previously is Ricardian Equivalence.

Take one such example, World War 2. Estimates I have seen are 1 by Valerie Ramey and 0.8 by Robert Barro. Given the enormous size of the fiscal stimulus (roughly 5.2 Trillion in comparative terms today), even a 0.8 multiplier meant that it did accumulate to a large increase in GDP. Krugman, including others, believe that the return of monetary policy combined with WW2 ended the Great depression, and enabled the post WW2 boom.

Now, do multiplier estimates in the context of war and peace really matter now? Robert Barro says that these are more reliable simply because it is much harder to calculate multiplier effects in light of business cycle fluctuations, relating to the endogenity problem discussed in the multiplier. But there are many good reasons why multipliers from WW2 have no relevance right now.

i) The economy in WW2 was in a ‘fully employed’ mode, the war effort required the full use of resources, and increased labour effort in light of the extreme circumstance.

ii)A corollary from i) is that, given the large amount of resources employed, and the absolute size of the package, it is plausible to say that the multiplier suffered from diminishing returns. This is a simple fact, and can be illustrated by this conceptual graph:

O- Optimum E-estimate
What the graph shows is that the fiscal stimulus of WW2 was likely to be past the optimal level of Government stimulus. Thus it is likely that given the optimum government spending is the spending required to reach full employment, the excess government spending ended up causing inflation, reducing the multiplier to 0.8. Given that the current fiscal stimulus package is insufficient to fill in the deflationary gap, we are suffering from a deficiency of spending! Barro’s use of WW2 is not wise in light of this fundamental difference.

iii) Another good point is that, due to the war effort, there was a significant rationing of consumption and investment to allocate more resources to the war effort. This is true of most wars, and one can say that in a war effort there is a natural crowding out of investment and consumption, not necessarily via increased military spending, but due to the nature of war and the need to divert resources to warfare for the good of the nation. At the moment, there is no rationing as such, except individual rationing on the part of increased precautionary savings and an attempt to reduce the debt by households and firms. In any case, Barro has not established whether WW2 spending had any direct crowding out effects due to the rationing process, and hence it cannot provide a precedent for predicting the amount of crowding out for this fiscal stimulus. Krugman rebuts Barro’s analysis by showing declines in both spending on new homes and autos dropped considerably as part of the rationing process, and picked up steadily after WW2 (as balance sheets became healthy due to the reduced private sector debt to GDP).

iv) On the other hand, In recessions due to a financial crisis, which dampen consumption and investment considerably, the adverse balance sheet effects mean that investment is constrained until debt to GDP levels go to fundamental levels, in other words, deleveraging will continue until firms are recapitalised and ready to borrow again. Whereas consumption and investment were crowded out in WW2 via rationing, in the present day private sector borrowing is deficient purely because of insufficient consumption demand and balance sheet problems. Thus fiscal stimulus, as I have explained in previous posts, does not crowd out private sector investment!

The above reasons show clearly that it is unwise to use WW2 as a precedent for analysis of the current situation. Another problem of course is that in recessions, it takes time for investment and consumption to return to normal levels. This is simply because investment is based on profitability, and if current sales in a business are low, a business is unlikely to invest, even if they expect the economy to be gaining traction. In fact, given that the capital stock is reducing due to insufficient investment, investment will eventually increase due to the ‘use, decay and obsolescence’ of capital. All of this takes time, of course, and there is no doubt that whatever stimulus the Government provides will filter its way through to increased sales for businesses due to the multiplier effect, and can stimulate business investment in this manner.

Barro does have some arguments however. For example,

There are reasons to believe that the war-based multiplier of 0.8 substantially overstates the multiplier that applies to peacetime government purchases. For one thing, people would expect the added wartime outlays to be partly temporary (so that consumer demand would not fall a lot). Second, the use of the military draft in wartime has a direct, coercive effect on total employment. Finally, the U.S. economy was already growing rapidly after 1933 (aside from the 1938 recession), and it is probably unfair to ascribe all of the rapid GDP growth from 1941 to 1945 to the added military outlays. In any event, when I attempted to estimate directly the multiplier associated with peacetime government purchases, I got a number insignificantly different from zero.

The arguments above do not make sense at all. Though I agree with his first point in that wartime outlays and the fiscal deficits were temporary, meaning that the ricardian equivalence effect was constrained, the consumer demand was indeed offset- due to the rationing required to generate funds for the war effort.

For the second point, the fact that it had coercive effects on total employment meant that it became an over-inflated economy, largely different from the under-employed economy of today.

The third point overestimates the multiplier for wartime government purchases, not peacetime. Given that we are facing a prolonged slump, any multiplier estimates need not consider the rapid GDP growth due to the private sector- and it makes the exogenous analysis much easier, when keeping a ceteris-paribus assumption. Another problem of course is that Barro implicitly neglects knowing the multiplier he learnt in ECON 101. The problem of isolating investment growth from Government spending is that the multiplier attempts to show that increases in Government spending lead to increases in consumption and investment- via the increased income it initiates. This effect is shown in the IS-LM model, where this fact is even more pronounced in light of accomodative monetary policy, which ensures that both investment and consumption increase. I am of the belief that the use of WW2 to calculate current-day multipliers does not make any sense at all.

What I dislike about Barro's analysis is that fundamentally an analysis of fiscal stimulus using historical examples should focus on fiscal stimulus in a financial crisis. I feel Barro's argument is a classic case of a right-wing economist with arguments tailored to his side of the political spectrum, rather than arguments with a strong factual and analytical basis. At current, there are reasons to believe that the multiplier for current stimulus is greater than the WW2 multiplier.

Friday, July 31, 2009

The real interest rate puzzle, a two-handed case

A nice example of the 'two-handed' aspect of economics is the notion of how a particular variable, say, the real interest rate, will move from the short-run to the long-run. My aim is to try to be able to interpret the movement of this variable across time, and the forces that determine it.

Reason to increase:

The under-investment in a recession will result in a shortage of capital stock to replace depreciation of capital. This shortage of capital stock will translate into negative and reducing inventory levels, which signal to producers to increase investment and capital stock, leading to increased use of resources and eventually to full employment. It is likely that the shortage of capital will make capital scarce- and thus increase the marginal efficiency/cost of capital. Another way of illustrating this is to shift the investment demand curve to the right; this results in upward pressure on real interest rate as well.

Right now the US is relying on an infinite source of capital inflow to fund its investment-savings shortfall. The escalating US debt may give rise to concerns of the ability of the Government to rein in deficits and reduce debt over time via reduced outlays and increased taxes. The removal of capital inflows can occur as investors lose confidence in US assets, and this capital flight will reduce the supply of capital and raise the real interest rate.

The combined effects of a falling dollar and rising real interest rates are tantamount to disaster, and many of the currency crises in Latin America, the Asian financial crisis, followed this path. To make it worse, nominal interest rates were in fact increased in these countries to maintain capital inflows- which futher worsened the domestic economy- fuelling doubts about the soundness of the economy- leading to more capital flight- forcing further interest rate increases...and this adverse feedback loop continued until the currency plunged and the economy underwent a prolonged recession. Now, this is unlikely to occur in the US, given that the source of capital inflows come from countries that require US demand to drive their export-sectors (China, Japan, for example).

Reason to decrease:

Well, we know that the collapse in risk tolerance has led to a widespread increase in liquidity and risk premia, as lenders have to hedge against the risk of default. The process of deleveraging has led to a widespread fall in asset prices, as expectations of bankruptcy impacts upon the asset values of banks, where people fear the fact that a bank sells assets is due to the fact that they are ‘lemon assets’. Now upon recovery, it is obvious that the healthy flow of credit will result in the reduction in credit spreads, with reduced risk premia.

Given that deflationary expectations are emerging, as unemployment increases past the natural rate and output growth falls below potential, this is increasing current real rates. Over time, as the economy begins to recover, the inflationary expectations will increase, lowering real rates for a given nominal rate.


How to deal with the opposing forces on real interest rates? The transition from short-run to long-run:

Typically real interest rates are lower in recessions and higher in a boom-time. This is because in a boom time there are more investment projects, more investment demand, which tends to put upward pressure on the real rate, as the marginal product of capital increases. The only exception I suppose happens when a systemic banking crisis causes a contraction in credit, and rising liquidity and risk premia on private market assets mitigate the necessary cash flow to keep corporate investment going. This is particularly evident in the following graph, which shows little change in mortgage and business rates despite excessive easing by the Fed:


(Graph from Woodward and Hall blog). This clearly shows that at current the credit crunch is leading to a rise in nominal and real interest rates, which are a principal reason for constraining investment and leading to the insufficient demand at present. On the face of this we would expect that real interest rates to lower as the credit crunch abates.

Another aspect is trying to distinguish between real rates and natural real rates persay. For example, at current we suffer from a situation of the real rate being above the natural rate of interest- this correlates to the excess supply of savings as households and firms are deleveraging. There is little doubt that the natural real rate is -ve at the moment, this is the real rate required to restore full employment. Studies conducted by the Fed and Goldman Sachs determine the nominal interest rate required at current is -5/-6%, as determined by a Taylor rule:


(Above graph from Krugman blog, study by Goldman Sachs). There is little doubt that if the natural real rate is seen as -ve at current, then it must move upwards as the economy recovers.

One last point is that, as I have mentioned in previous posts, this crisis is due principally to a global savings glut- which has fed US demand for funds and led to very low interest rates in the US. This was partially due to the fact that investment demand was low following the dot-com bust, and interest rates went to fundamentally unsound levels- fuelling a residential investment boom. Now nominal interest rates remain low, and real rates are likely to remain low once the credit crunch abates- simply because households and firms are in the process of reaching +ve equity, and firms, rather than re-investing cash flow, are likely to use it to pay debt. I predict this insufficient investment will persist until firms and households have delevaraged, and private debt to GDP ratio is more sound. Once physical capital has depreciated and requires replacement, once house prices start trending upwards, it will provide an impetus for physical and residential investment, and increased investment demand for loanable funds will raise real and nominal rates.

Whether this process described above will occur will depend on the persistence of capital inflows into US, which in turn is based on confidence in the $US and whether foreigners believe US debt is guaranteed and will be non-monetised. I believe that the capital inflows into US will reduce over time- as developed countries like China and India open their capital accounts- we should expect higher rate of return in these countries, and a reallocation of capital inflows into these countries. However I doubt that such capital flight from the US will be drastic enough to increase real interest rates in the US, and I do not forsee such a reallocation of capital inflows in the near future.

A great policy lesson from this crisis is that excessively low real rates can cause bubbles. The problem is keeping interest rates low for a prolonged period of time. Unfortunately a big fallback of inflation targeting is that interest rates that are consistent with a stable inflation are inconsistent with asset prices. In the circumstance that asset prices are driven by speculation, then real rates should be increased to curb the increase in asset prices, and ensure they grow at a more sustainable rate. Unfortunately, given underlying inflation is stable, monetary policy becomes insensitive to asset price bubbles- and in the leadup to the housing bubble- the Fed and Treasury encouraged residential investment and ignored the possibility of a house price collapse.

I think the residue from this crisis will result in a more protracted form of lending and securitisation as financial instituions become more risk-averse. This will constrain lending and put further upward pressure on real interest rates. In conclusion, I believe that real interest rates will remain low during the recession (but still above the equilibrium/natural rate of interest), but there are good reasons to believe that real interest rates will rise in the long-run, in the recovery-phase and beyond.

To finish, let me illustrate my short-term/long-term analysis of real interest rates via a graph:


The blue curve is for the natural real interest rate, the black curve for the real interest rate. Note that the period of under-investment corresponds to the period directly after the credit crunch has abated, and is the period of the recession where private sector borrowing is still reducing or below the level required in the recovery phase. I mark the recovery phase as the period in which both the real rate and natural rate of interest are increasing, however the magnitude of this increase is uncertain.

Notice that the reason why the real rate cannot converge to the natural rate during the recession is because of the 0 lower bound on nominal rates! Also, note that I assume that real rate converges to natural rate as economy approaches full employment.

Monday, July 27, 2009

A Chicagoan perspective on fiscal policy

In my blog I have been unrelenting in my factual abuse of extreme right-wing views such as the 'treasury view'. I have never given the chance to present some dignified views of the right. In this post I shall summarise a presentation given by a Chicago University panel featuring Kevin Murhpy, John Huizinga and Robert Lucas. I will be covering Kevin Murhpy's discussion, as that was the most thought-provoking of the three.

Murphy provides a simple model to illustrate how any model that predicts a stimulus to have a multiplier effect depends on certain parameters, and how differing estimates of those parameters drastically change the outcome of whether one is for or against a stimulus. This can be shown as follows:

The parameters are alpha- which measures inefficiency of government (if –ve it implies government is more efficient relative to private sector). Chicago economists typically see alpha as positive, which means that it reduces the nominal measure of government spending. This alpha is effectively a measure of how useful the government purchases and tax cuts are in terms of causing second round and multiple effects of increasing income, and whether a ‘bridge to nowhere’ will actually lead to improved outcomes for society- by raising welfare, rather than just providing an increased measure of GDP. Krugman for example believes the social marginal benefit of increased government purchases exceeds the marginal cost when the economy is below full employment (with the additional constraint of the 0 lower bound preventing a monetary equilibrium from achieving full employment). However conservatives argue that the social benefit is at times unjustified in light of the fact that


i) There are a limited number of ‘shovel ready’ infrastructure projects

ii) There are time lags involved with bidding and organising projects

iii) Some re-allocation of resources is involved in terms of absorbing resources from the private sector.

iv) There is an implicit trade-off between the notion of stimulating the weak parts of the economy- such as Detroit, and the fact that money would be better spent in booming parts of the economy- in which there is inherently higher demand for infrastructure projects.

v) Suppose the projects are aimed at revitalising defunct sectors, such as construction (due to the stock overhang and the severe reduction in demand for housing). It is debateable whether trying to improve the construction industry will pay off in terms of adding to a current excess stock. Re-allocation of workers should occur in a way in which it can be productive for the economy.

vi) In trying to solve v), we could try to re-train construction workers to commit themselves to different activities, for example. Whether this is practical is debateable as trying to reallocate labour is hard to coerce.

These, and many other reasons from the conservative to argue for alpha being positive, and certainly this must be taken into account in terms of assessing the efficacy of the stimulus package.

D is deadweight loss- that is incurred due to the distortions that arise with debt-financed taxes that will be dealt with in the long-term. This goes under the assumption that net present value of taxes are tied to government purchases, implying that taxes need to be raised at some point. Furthermore, Murphy makes the point that the Obama stimulus package seems to consist of tax rebates and transfers in the short-run followed by increases in the marginal rates in the long run. The distortionary effects of taxes, such as the substitution effect, measured by the difference in work effort from a reduction in the marginal income tax rate compared to a tax rebate, show clearly that there are distortions/ deadweight losses incurred from raising marginal tax rates.

F is the fraction of ‘idle resources’ in the economy. Typically, when at full employment, F is 0. However, in these circumstances, with investment below par due to the credit crunch, severely affecting both private sector consumption and investment, with GDP below trend by about 4% and projected at 8% for the end of 2009, F is most likely in close correlation with the business cycle. As mentioned by Murphy, F is also an indicator of the multiplier. If F>1, then the government spending not only uses idle resources, but the rise in income enables the use of more idle resources than intended in the direct effect of increased G. Note that, with accommodative monetary policy (as noted by the fact that any increases in Government financing typically uses the excess loanable funds created by excess supply of money at the above equilibrium interest rate), this means that the crowding out effect is minimal and the level of savings allocated to private sector will change only slightly, if any.

Lamda is the value of idle resources. This is an interesting parameter, as typically one would think that lamda is 0, that any idle resources are of no value. But we know that unwanted inventory accumulation will be written down in value- but it still has value. People not working still value time and are intrinsically worth something…so perhaps there is reason to believe lamda can be positive. Suppose the value of lamda is too high. Would it be more or less encouraging to pro-fiscal stimulus? Interestingly it would mean that the cost of using idle resources increase, and what lamda does is accept the fact that the use of resources, whether private or idle- does incur a cost which must be dealt with in the cost-benefit analysis. And so here it is:


Notice that the first term is the benefit, which is weighed against the 3 costs, the cost of using private resources, the cost of using idle resources, and the deadweight cost. Notice that to put numerical estimates we make G=1, as that way f can be an estimate of the multiplier. Notice that G=1 is required as suppose c is value of private sector resources, then technically the above equation should have (1-f)*c. However, given that we assume the value of private sector resources is equal to value of government spending (with alpha=0), the c is implicitly 1. Thus, we can simplify the inequality to


Now for the fiscal stimulus to have net benefits then it would have to satisfy the above inequality. Now Murphy gives 3 estimates. Let us take team Obama.
Team obama believe that f=1.5, that lamda is 0, alpha is 0 or possibly negative, and d at a conservative estimate of 0.8 (Using Murphy’s neutral estimate from Feldstein’s analysis). The inequality naturally holds as 1.5>0.8. Take Fama’s case. He believes in a complete crowding out effect, and so holds that f=0, and that government spending can only occur in as far as any deadweight loss of future taxes is offset by a relative efficiency of government spending over private sector spending- compensating for future taxes. This may well be the analysis behind government spending during an economic boom. A middle-ground analysis, with conservative estimates of f=0.5, lamda=0.5, means that with d=0.8, government spending needs to be atleast 55% more efficient than private sector spending (ie alpha needs to be less or equal to –0.55). Thus one can see why so many Chicago economists scoff at this Keynesian stimulus package!